The Electric Sky
Bright Light Matter

by Donald E. Scott,
Ph.D. (Electrical Engineering)

The M1 Pulsar
There is a revolution just beginning in astronomy/cosmology that will
rival the one set off by Copernicus and Galileo.
This revolution is based on the growing realization that the cosmos is highly
electrical in nature. It is becoming clear that 99% of the universe is
made up not of "invisible matter", but rather, of matter in the
plasma state. Electrodynamic forces in electric plasmas are much stronger
than the gravitational force.
Mainstream astrophysicists are continually
“surprised” by new data sent back by space probes and orbiting
telescopes. That ought to be a clue that something is wrong. New
information always sends theoretical astrophysicists "back to the drawing
board". In light of this, it is curious that they have such
"cock-sure" attitudes about the infallibility of their present
models. Those models seem to require major "patching up" every
time a new space probe sends back data.
Astrophysicists and astronomers do not study
experimental plasma dynamics in graduate school. They rarely take any
courses in electrodynamic field theory, and thus they try to explain every new
discovery via gravity, magnetism, and fluid dynamics which is all they
understand. It is no wonder they cannot understand that 99% of all cosmic
phenomena are due to plasma dynamics and not to gravity alone.
When confronted by observations that cast doubt on
the validity of their theories, astrophysicists have circled their wagons and
conjured up pseudo-scientific invisible entities such as neutron stars, weakly
interacting massive particles, strange energy, and black holes. When
confronted by solid evidence such as Halton Arp's photographs that contradict
the Big Bang Theory, their response is to refuse him access to any major
telescope in the U.S.
Instead of wasting time in a futile battle trying to
convince entrenched mainstream astronomers to seriously investigate the
Electric/Plasma Universe ideas, a growing band of plasma scientists and
engineers are simply bypassing them. A new electric plasma-based paradigm
that does not find new discoveries to be “enigmatic and puzzling”, but rather
to be predictable and consistent with an electrical point of view, is slowly
but surely replacing the old paradigm wherein all electrical mechanisms are
ignored.
Electric Cosmology
Stellar Evolution
If
the Sun is essentially an electrical phenomenon, as seems to be the case, and
it is also a fairly typical star, then all stars should exhibit properties
that are consistent with the Electric Sun (ES) model. Do they? Let us
extrapolate the ES model and compare it to what we have observed about stars.
The Hertzsprung-RussellDiagram
In
the HR diagram, as it is usually presented, the vertical axis is labeled with two
scales: Absolute Magnitude (linear scale from about 18th magnitude at the
bottom running up to perhaps -8 or so at the top), and Luminosity x Sun (log
scale with 0.00001 at the bottom running up to 100,000 at the top). The
horizontal axis also is labeled with several scales: Spectral Class - left to
right: O and B [blue], A [white], F [yellow], G [yellow-orange], K [orange], M
[red]).
Our Sun, being a fairly typical star, falls almost at the center of the diagram (at Luminosity = 1 and Absolute magnitude. = 5, Spectral Class G, and (photospheric) Temp. = 6,000K). The points on the plot seem to group nicely, generally forming a long, slightly diffuse line, that snakes from the upper left down toward the lower right. The line falls very steeply at the lower right end. There are two other less populated clouds of points: one group at the upper right and another one strung out across the bottom of the plot from a concentration in the lower left of the diagram.

Add A New Horizontal
Axis Scale
In
the ES model the important variable is: current density (Amps/sq m) at the
star's photospheric surface. If a star's current density increases, the
arc discharges on its surface (photospheric granules) get hotter, change color
(away from red, toward blue-white), and get brighter. The absolute
luminosity of a star, therefore, depends on two main variables: current density
at its effective surface, and its size (the star's diameter).
Therefore, let us add a new scale to the horizontal axis of the HR diagram: 'Current Density at the Surface of each Star'. Consider moving from the lower right of the HR diagram toward the left. In so doing we are moving in the direction of increasing current density at the star's surface.
Red and Brown Dwarfs
The
first region on the lower right of the diagram is where the current density has such
a low value that double layers (DLs) (photospheric granules) are not needed by
the plasma surrounding the (anode) star. This is the region of the brown
and red "dwarfs" and giant gas planets. Recent discoveries of
extremely cool L - Type and T - Type dwarfs has required the original diagram
to be extended to the lower right (See below). These 'stars' have extremely low
absolute luminosity and temperature.

If all stars are indeed powered by a nuclear fusion reaction as is claimed, with the T dwarfs we must be in the 'cold fusion' range! Indeed, for fusion reactions to occur, standard theory requires that the temperature in a star's core must reach at least three million K. And because, in the accepted model, core temperature rises with gravitational pressure, the star must have a minimum mass of about 75 times the mass of the planet Jupiter, or about 7 percent of the mass of our sun. Many of the dwarfs do not meet these requirements. One mainstream astrophysicist, realizing this, has said that these dwarfs must be powered by 'gravitational collapse'.
The orbiting X-ray telescope, Chandra, recently discovered an X-ray flare being emitted by a brown dwarf (spectral class M9). This poses an additional problem for the advocates of the stellar fusion model. A star this cool should not be capable of X-ray flare production.
However, in the ES model, there are no minimum temperature or mass requirements because the star is inherently electrical to start with. In the ES model (if a brown/red dwarf is operating near the upper boundary of the dark current mode), a slight increase in the level of total current impinging on that star will move it into the normal glow mode. This transition will be accompanied by a rapid change in the voltage rise across the plasma of the star's atmosphere. Maxwell's equations tell us that such a change in voltage can produce a strong dynamic E-field and a strong dynamic magnetic field. If they are strong enough, dynamic EM fields can produce X-rays. Another similar phenomenon can occur if a star makes the transition from normal glow to arc mode.
As we progress leftward in the HR diagram, at first the plotted points move steeply upward; we enter the spectral M range where some arc tufting becomes necessary to sustain the star's electrical discharge.
As current density increases, tufts (plasma in the arc discharge mode) cover more and more of the surface of each star, and its luminosity increases sharply – plasma arcs are extremely bright compared to plasma in its normal glow mode. You can look directly at neon signs but not at electric arc welders. This accounts for the steepness of the HR curve in the M region – a slight increase in current density produces a large increase in luminosity. As we move upward and toward the left in the diagram, stars have more and more complete coats of photospheric arcs (tufting).
 A case in point – NASA recently
discovered a star, half of whose surface was "covered by a
sunspot". A more informative way to say this would have been that
"Half of this star's surface is covered by photospheric
arcing." The present controversy about what the difference is
between a giant gas planet and a brown dwarf is baseless. They are
members of a continuum – it is simply a matter of what the level of current
density is at their surfaces. NASA's discovery supplies the missing link
between the giant gas planets and the fully tufted stars. In fact, the
term "proto-star" may be more descriptive than "giant gas
planet".
A case in point – NASA recently
discovered a star, half of whose surface was "covered by a
sunspot". A more informative way to say this would have been that
"Half of this star's surface is covered by photospheric
arcing." The present controversy about what the difference is
between a giant gas planet and a brown dwarf is baseless. They are
members of a continuum – it is simply a matter of what the level of current
density is at their surfaces. NASA's discovery supplies the missing link
between the giant gas planets and the fully tufted stars. In fact, the
term "proto-star" may be more descriptive than "giant gas
planet".
Main Sequence Stars
Continuing
toward the left, beyond the "knee of the curve", all these stars (K
through B) are completely covered with tufts (have complete photospheres),
their luminosity no longer grows as rapidly as before. But, the farther to the
left we go (the higher the current density), the brighter the tufts become, and
so the stars' luminosities do continue to increase. The situation is analogous
to turning up the current in an electric arc welding machine. The increased
brightness of the arcs accounts for the upward slope of the line toward the
left. Mathematically we have the situation where the variable plotted on
the horizontal axis (current density) is also one of the factors in the quantity
plotted on the vertical axis (luminosity). The more significant this
relationship is, the more closely the plot will approach a 45 degree straight
line.
That the stars do not all fall precisely on a line, but have some dispersion above and below the line, is due to their variation in size. The relatively straight portion of the HR diagram is called the 'main sequence'. This nomenclature gives a false impression, that stars move around 'sequentially' in the HR plot. The HR diagram is a static scatter plot, not a sequence.
White and Blue Stars
When
we get to the upper left end of the main sequence, what kind of stars are
these?
This is the region of O type, blue-white, high temperature (35,000+ K) stars.
As we approach the far upper-left of the HR diagram (region of highest current
density), the stars are under extreme electrical stress - too many Amps per sq.
meter. Their absolute luminosities approach 100,000 times the
Sun's. Even farther out to the upper left is the region of Wolf-Rayet
stars. Extreme electrical stress can lead to such a star's splitting into
parts, perhaps explosively. Such explosions are called novae.
The splitting process is called fissioning. A
characteristic of Wolf-Rayet stars is that they are losing mass rapidly.
Fissioning
Wal
Thornhill once said:
"….. internal electrostatic forces prevent stars from collapsing
gravitationally and occasionally cause them to "give birth" by
electrical fissioning to form companion stars and gas giant planets. Sudden
brightening, or a nova outburst marks such an event. That elucidates why stars commonly
have partners and why most of the giant planets so far detected closely orbit
their parent star."
If
a sphere of fixed volume splits into two smaller (equal sized) spheres, the
total surface area of the newly formed pair will be about 26% larger than the
area of the original sphere. (If the split results in two unequally sized
spheres, the increase in total area will be something less than 26%.) So,
to reduce the current density it is experiencing, an electrically stressed,
blue-white star may explosively fission into two or more stars. This
provides an increase in total surface area and so results in a reduced level of
current density on the (new) stars' surfaces. Each of two new (equal
sized) stars will experience only 80% of the previous current density level and
so both will jump to new locations farther to the lower-right in the HR
diagram.
If the members of the resulting binary pair turn out to be unequal in size, the larger one will probably have the larger current density - but still lower than the original value. (This assumes that the total charge and total driving current to the original star distributes itself onto the new stars proportionally to their masses.) In this case, the smaller member of the pair might have such a low value of current density as to drop it, abruptly, to "brown dwarf" or even "giant planet" status. That may be how giant gas planets get born (and are in close proximity to their parents).
There was an interesting statement made in this regard in the Jan. 1, 2001 issue of Science Now magazine (p.4). "Astronomers are scratching their heads over a strange new planetary system. A team discovered a huge gas ball -- apparently a failed star called a brown dwarf -- circling a star that holds another planet in its sway. But no one understands how something so massive as a brown dwarf could form so close to a normal star with a planetary companion." This was in an article called "An awkward trio disturbs astronomers" by G. Schilling.
The final distribution of mass and current density is sensitive to the mechanics of the splitting process. Such a process can only be violent - possibly resulting in a nova eruption. Some mass may be lost to the plasma cloud that later can appear as a planetary nebula or nova-remnant that surrounds the binary pair. If the charge on the original star was highly concentrated on or near its surface, and the fissioning process is similar to the peeling off of a onion's skin, then most of that original charge (and current) may end up on the offspring star that is constituted only of the skin of the original star. In this way the smaller, rather than the larger of the two members of the resulting binary pair, can be the hotter one. In any event, both stars will move to different positions in the HR diagram from where their parent was located.
Stellar Evolution
Mainstream
astronomy attempts to describe how stars 'age' (run out of nuclear fuel) and
slowly migrate,
taking hundreds of thousands of years to do so, tracing paths from one location
on the HR diagram to another (the star going from one spectral class to
another). The paths that stars 'must take' are, of course, completely
predicated on the assumption that stars are fueled by the various stages of
nuclear fusion of the lightest elements.
The ES model does not make that assumption. Humans have not been around long enough to actually observe any stars making the predicted slow migrations from one place on the HR diagram to another. So, at present, slow "stellar evolution" is another one of those complicated theoretical constructs that live brightly in the minds of astrophysicists without any observational evidence of their actual existence.
Examples That Falsify (Disprove) The Accepted Stellar Evolution Process
FG Sagittae
The
star FG Sagittae breaks all the rules of accepted stellar evolution. FG
Sagittae has changed from blue to yellow since 1955! It, quite recently,
has taken a deep dive in luminosity. FG Sagittae, is the central star of
the planetary nebula (nova remnant?) He 1-5. It is a unique object in the
sense that for this star we have direct evidence of stellar evolution but in
a time scale comparable with the human lifetime. [CCD Astronomy, Summer
1996, p.40.]
So, after abruptly brightening by four magnitudes, it has dropped seven magnitudes. From the end of the last century FG Sagittae has moved across the HR diagram changing from a normal hot giant to a "late spectral type" (cool) star with marked changes in its surface chemical composition. Its present surface temperature is in the range of 4000K. This is not the kind of slow stellar 'evolution' mainstream astrophysicists preach.
And FG Sagittae is a binary pair!
The official wording was, "In 1995 FG Sge changed in brightness in a quite sporadic manner from V~10.5 to ~13.0 according to the data by Hungarian Astronomical Association-Variable Star Section. During the spectral observations on 9/10 and 10/11 August, FG Sge was very faint (HAA-VSS data: V~12.5-13.0, according to Variable Stars Observers' League of Japan: ~13.3) and therefore erroneously the visual companion 8'' apart from FG Sge was actually observed. This is probably the first high resolution spectrum of the companion ever obtained. The spectrum turned out to correspond to a quite normal giant with the spectral type around K0."
Is FG Sagittae an example of the binary fissioning (caused by electrical stress) that was described above? It seems to have all the basic characteristics: nova-like brightening followed by loss of luminosity and loss of temperature - moving to a different spectral type with marked changes in its surface chemical composition, discovery of a binary companion, and the entire systems lies within a nebulous nova remnant.
Two More Examples That Falsify the Accepted Stellar Evolution Process
Virginia
Trimble, professor of physics at the University of California, Irvine, and
visiting professor of astronomy at the University of Maryland, has said
recently:
"We
don't often see stars change their spectral types in a human lifetime. Thus, FG
Sagittae, which brightened, cooled from about BO to K, and added lines of
carbon, barium, and other elements to its spectrum in the century after 1890
was long seemingly unique. The standard interpretation has been that it
experienced its very last flash of helium shell burning (the products are
carbon and oxygen) and was about to become an R Coronea Borealis variable.
These are carbon-rich stars that fade suddenly and unpredictably (which FG Sge
started doing a couple of years ago) and that have hydrogen-depleted
atmospheres (which FG Sge has just developed). In addition, the "galloping
giant" is no longer alone. Examination of old images and spectrograms
reveal that V 605 Aquilae, studied by Knut Lundmark in the 1920's
was a similar sort of beast, though it is now very faint And the latest recruit
is V 4334 Sagittarii, better known as Sakurai's object, for its
1994 discoverer. It, too, changed both spectral type and surface composition
very rapidly, and is now hydrogen-poor and carbon-rich, and well on its way to
becoming the century's third new R CrB star."
And Yet A Fourth Example - V838 Monocerotis
On
October 2, 2002, NASA's Astronomy Picture of the Day (APOD) announced what is
to them another "mystery star".
The
official "explanation" reads, in part:
"V838
Mon was discovered to be in outburst in January of this year. Initially thought
to be a familiar type of classical nova, astronomers quickly realized that
instead, V838 Mon may be a totally new addition to the astronomical zoo.
Observations indicate that the erupting star transformed itself over a
period of months from a small under-luminous star a little hotter than the Sun,
to a highly-luminous, cool supergiant star undergoing rapid and complex
brightness changes. The transformation defies the conventional
understanding of stellar life cycles. A most notable feature of V838
Mon is the "expanding" nebula which now appears to surround it."
[Ital and emphasis added.]
So
now there are at least four prime examples of stars that do not evolve
according to the accepted thermonuclear model of how stars are powered.
These are stars that falsify the conventional understanding of
stellar life cycles. All of them act in a manner predicted by the
Electric Star hypothesis.
Red Giants
The
diffuse group in the upper right hand corner of the HR diagram are stars which
are cool (have
low values of current density powering them) but are luminous and so are
thought to be very large. They are highly luminous only
because of their apparent size. And that size may well be due to having a
huge corona rather than an inherently large diameter. At any rate, these
are the 'red giants'. They are not necessarily any older than any other
star. Notice that some are relatively quite cool - in the range of 1000
K. How do stars at this low a temperature maintain an internal fusion
reaction? The simple answer is: They cannot! And they do not! And beneath
an extended diffuse corona, they may be quite small stars.
White Dwarfs
Similarly,
the group in the lower left hand corner have very low absolute luminosity but
are extremely hot.
The ES model simply explains them as being very small stars that are
experiencing very high current densities. These are the "white
dwarfs." Although most of them are concentrated in the
lower-left corner of the diagram, the white dwarf group actually extends thinly
across the bottom of the diagram. Thus the name white dwarf is a kind of
misnomer. The shape of this thin grouping begins to drop off steeply at
its (cooler) right end much as the main sequence does.
"The observed white dwarfs are basically cooling embers. The nuclear fire of the stars burned out billions of years ago. The light emitted comes from the heat remaining from the earlier nuclear burning. By measuring the spectrum of the light, the brightness in various colors, the temperatures of the stars were determined. The two coolest of the white dwarfs studied, PSR J0034-0534 and PSR J1713+0747, are 3400 degrees Kelvin (5600 F), making them the coolest known white dwarfs. For comparison, the surface of the sun measures 5800 degrees Kelvin and the coolest previously known white dwarfs are 4000 degrees Kelvin."
But then, why are these relatively cool stars called "white"? One presumes it is only because they seem to be members of the grouping in the HR diagram that was originally given that name.
Spectral Lines in
Various Types of Stars
In a paper entitled “Stellar Spectra” (Aeon, Vol. V, No. 5, Jan. 2000, p.
37.) the late Earl R. Milton, Professor of Physics, University of
Lethbridge reported on research he had performed on spectral line broadening in
1971 while at the Dominion Astrophysical Observatory in Vancouver, British
Columbia. This work provides strong evidence in support of the Electric
Sun model.
If, on the other hand, a sufficiently strong electric current is passed through a gas, the gas itself will emit a light spectrum in which only a few discrete colors (frequencies) appear. These are called emission lines. They are located precisely at those wavelengths (frequencies) at which that same gas produces absorption lines as described in the previous paragraph.
The spectra of most stars are heavily dominated by absorption lines. Spectra from the cooler stars (such as types G and K) are dominated by molecular bands arising from oxides (like ZrO and TiO) and from compounds of carbon like CH, CN, CO, and C2. Stars like the Sun (type G) show “metal” absorption lines. Astronomers call any element heavier than Helium a “metal”. In fact the Sun shows the presence of 68 of the known elements. The spectra of hot O and B type stars show few lines, and what lines they do have appear quite blurred or “broadened”. There are a few possible causes of this broadening.
If the absorbing gas is in a magnetic field, each line may split, symmetrically, into multiple, closely spaced lines. This is called the Zeeman effect - named for its discoverer, Pieter Zeeman (1865-1943).
If the gas is in an electric E-field, then lines split unsymmetrically - this is called the Stark effect named for Johannes Stark (1874-1957). These secondary lines are very closely spaced in frequency (wavelength) and so the effect is sometimes called line-broadening or blurring. A most important property is that the degree of Stark (electric field) broadening depends on the atomic mass of the affected gas. The lines of heavy elements are only slightly broadened whereas those of lighter atoms and ions are quite smeared out. This effect is not noted in Zeeman (magnetic field) broadening.
As we progress from right to left up the “main sequence” in the Hertzsprung-Russell diagram – from the less electrically stressed stars toward those experiencing higher current input, we see an increasing broadening of spectral lines. In fact at the upper left end (O-type stars) there is so much blurring that we can distinguish very little structure in the line spectra. Is this caused by the increasing strengths of the E-fields in the stars' DLs as electrical stress increases? And, is increased E-field strength the only possible explanation for this line broadening? Milton states that two pieces of evidence strongly suggest that the answer is yes.
In highly stressed B-type stars:
1. A line at 4471.6 Angstroms is accompanied by a 'forbidden' partner at 4469.9 Angstroms. It is well known that this latter line only occurs when an electric field is present.
2. There is an extreme difference between the degree of broadening of the lines from hydrogen and helium (light elements) and those arising from sodium and ionized calcium (heavier elements). This effect is only noted in Stark effect broadening.
The usual mainstream explanation of line broadening is that the star must be rotating rapidly – light from the limb going away from us is red shifted, and light from the limb coming at us is blue shifted – the total effect being to smear out the line widths. BUT, if that were the true explanation, the lines from hydrogen should be no more smeared out than those from calcium. Both of these observations (1 and 2 above) strongly suggest that it is the presence of a strong electric field that is selectively broadening the spectral lines in B-type stars.
There is no simple explanation of these spectral effects via the (non-electrical) thermonuclear core model. So, let us consider to what degree this phenomenon – the existence of spectral absorption lines and their selective broadening – is consistent with the Electric Sun model.
In the Electric Sun model it is clear that the photosphere is the site of a strong plasma arc discharge. This produces the Sun's continuous visible light spectrum. Immediately above this in the Sun’s atmosphere there is the Double Layer (DL) in which an intense, outwardly directed electric field resides. It is within this strong E-field that many heavy elements are created by z-pinch fusion. Recall that the strong E-field dethermalizes the ions in that region and thus it is the (relatively) coolest layer of the Sun's atmosphere. Light that originates in the photosphere passes through the relatively cool, newly formed heavier elements in the DL. These heavier elements selectively absorb energy from the light's spectrum and thus the absorption lines are created. In fact they are created in exactly the place where the Sun's E-field is strongest. Thus we have the ideal situation for selective broadening of those lines due to the Stark effect.
In those instances wherein we see emission lines in a star’s spectrum we may speculate that, just as in the laboratory, the easiest way to generate them is by passing a strong electric current through a tenuous gas cloud. For example, type W (Wolf-Rayet) stars are under such intense electrical input that they are hotter even than type O stars. They are located to the left of the top of the Hertzsprung-Russell diagram. They typically show strong emission lines in their spectra. Since these stars experience stronger electrical currents than any other type star, there is ample probability that any tenuous coronal gases will be excited by such currents to produce emission lines.
At the other end of the HR diagram, type M (relatively cool) stars also sometimes exhibit spectral emission lines. Can we explain this via the Electric Sun model as well? Consider the star Betelgeuse – a type M red 'giant'. The average density of Betelgeuse is less than one ten thousandth of the density of the air we breathe. A star of such tenuous nature has often been called a 'red hot vacuum'. The outer surface of this tenuous sphere (the radius of which is larger than the orbit of Jupiter from the Sun) has been found to have three bright areas of photospheric tufting above which we would expect to find DLs wherein z-pinch fusion may occur. It is from this source that the absorption lines in the M-type spectra come. But, in addition, Betelgeuse is surrounded by a coronal plasma that extends out several hundred radii from the surface of the star. This corona is even less dense than the star itself. Thus we have a gigantic gas cloud through which (according to the Electric Star model) electric current is passing – an ideal situation for the production of spectral emission lines.
So, once again, in the case of stellar emission and absorption lines and their selective broadening, we observe a stellar phenomenon that is more consistent with the Electric Sun model than it is with the “fusion core” model (in which, of course, no mention is made of electric fields).
Population I and II
Stars
There
are many ways to categorize stars. While observing the Andromeda Galaxy,
M 31, astronomer Walter Baade discovered that he could distinguish between two
general types of stars in that object. He called them Population I and
Population II.
Population II stars are not found in the arms, but rather, in the nucleus of the galaxy and in globular clusters that are situated around its periphery. These are less luminous, cooler, with fewer heavy elements; many are red and yellow giants; there is almost no dust and gas in their vicinity. Mainstream astronomers call these stars "old".
So we see that there is very roughly a lower-left half (Population I), upper-right half (Population II) partitioning of the HR diagram. Therefore, from the Electric Star point of view, we note that the stars in Population I are more heavily electrically stressed than those in Population II. In the next page we discuss the general shape of galaxies and then will be able to point out that the usual physical locations of these two star types in a typical galaxy are vastly different in electrical activity. The arms (where Population I type stars are usually located) are the focus of strong Birkeland current densities.
Blue Stragglers
Up
until recently no (Population I) O or B type stars were observed in globular
clusters.
It was thought that all stars in any given globular cluster were of a similar
age (old - Population II). Therefore, it came as a big shock when it was
discovered that there were some blue "stragglers" (stars that hadn't
"aged properly") in certain clusters. It was said, in awe, that
these stars were "rejuvenated stars that glow with the blue light of young
stars"! "Stellar evolution" doesn't seem to be working too
well in these cases.
Stellar densities in galactic nuclei are typically 50 - 60 stars per cubic light year. Each star occupies, say, 1/60 cubic LY. The cube root of 1/60 is approximately 0.25 - so, each star is 1/4 light year from its neighbor. (Remember Burnham's model: Two specks of dust 1/100 inch in diameter separated by a distance of 1/4 MILE.) What is the probability of their colliding?
From the ES point of view, any star can move quickly across the HR diagram if its electrical environment changes. Anyone who has seen the aurora's plasma curtains moving and folding in the polar sky realizes that Birkeland current filaments are not fixed, static, things. They move around. If the galactic Birkeland currents move around, it is likely they will move relative to some stars - either increasing or decreasing the current densities these stars experience. A blue star is just one that is experiencing the full brunt of a strong Birkeland current. "Blue stragglers" aren't stragglers at all. They are just blue.
Variable Stars
When
I was researching topics for this article, Wal Thornhill said to me,
"Have
a look at variable stars, particularly bursters, where I think you will find
the brightness curve is like that of lightning with a sudden rise time and
exponential decay. Some stars are regular and others irregular. The
irregular ones seem to average the power over the bursts. When they are
more frequent, the energy is less per burst. If there is a long latency,
the next burst is more powerful. It's the kind of thing you would expect
from an electrical circuit when the trigger level is variable and the power
input constant.
I think many variable stars are actually binaries with some kind of electrical interaction. Long period Miras (A type of variable star) may actually have an object orbiting within the shell of a red giant (as I have proposed for the proto-Saturnian system)"
Following
Wal's suggestion, I looked at the recent Hubble image of Mira itself, the
flagship star of that class of variable stars. Mira's image reveals a
huge plasma emission on one side of the star. The official explanation
includes the words, " Mira A is a red giant star undergoing dramatic
pulsations, causing it to become more than 100 times brighter over the course
of a year. …. Mira can extend to over 700 times the size of our Sun, and is
only 400 light-years away. The …. photograph taken by the Hubble Space
Telescope shows the true face of Mira. But what are we seeing? The unusual
extended feature off the lower left of the star remains somewhat mysterious.
Possible explanations include gravitational perturbation and/or heating from
Mira's white dwarf star companion." [Italics added.]
There are many examples of unequally sized, closely spaced, binary pairs that are variable and emit frequent nova-like explosions. The list includes:
- SS Cygni - A yellow dwarf and a hot blue-white dwarf. Orbital period 6.5 hours! Separation distance 100.000 miles or less. Burnham asks, "Is SS Cygni ..... dying out after having been [a full scale nova] in the past?"
- U Geminorum - A B-type blue dwarf and a G-type dwarf. Orbital period 4.5 hours! Separation distance a few hundred thousand miles. In this case Burnham states, "Spectroscopic studies reveal the existence of a "rotating ring of gas" (plasma) around the blue star, and it appears that the explosive increase of light is due not only to the brightening of the star, but to a large increase of radiation from the cloud."
- Z Andromedae and R Aquarii - Both of these consist of a hot blue dwarf mated to a red giant.
- T Coronae and RS Ophiuchi - Both have recurrent nova-like eruptions and are close binary systems.
Gamma
Ray Bursters
In
1998 NASA gave their description of what constitutes a "gamma ray
burster".
"October 13, 1998: Cosmic gamma-ray bursts have been called the greatest
mystery of modern astronomy. They are powerful blasts of gamma- and
X-radiation that come from all parts of the sky, but never from the same
direction twice. Space satellites indicate that Earth is illuminated by 2 to 3
bursts every day. What are they? No one is certain. Until recently we didn't
even know if they came from the neighborhood of our own solar system or perhaps
from as far away as the edge of the universe. The first vital clues began to
emerge in 1997 when astronomers detected an optical counterpart to a gamma-ray
burst. In February 1997 the BeppoSAX X-ray astronomy satellite pinpointed the
position of a burst in Orion to within a few arcminutes. That allowed
astronomers to photograph the burst, and what they saw surprised them. They
detected a rapidly fading star, probably the aftermath of a gigantic
explosion, next to a faint amorphous blob believed to be
a very distant galaxy." [Italics added.]
Doesn't
this sound like fissioning again? An explosion, followed by a rapidly
fading star, accompanied by some sort of companion! Might it
be that the reason they "never [come] from the same direction twice"
is that the creation of the binary pair has relieved the electrical stress (at
least for a long enough time that we humans haven't yet seen a recurrence)?
The February 2001 issue of Sky & Telescope magazine contains these words,
"Does
every gamma-ray burst begin with the supernova explosion of a massive
star? New observations from NASA's Chandra X-ray Observatory and the
Italian-Dutch BeppoSAX satellite suggest this is so. Some astronomers
think it's still too early to draw firm conclusions, though they hail the new
observations as revolutionary. In any case, a link between gamma-ray
bursts and supernovae seems to be convincingly confirmed."
Pulsars
Although
pulsars do not occupy a specific place in the HR diagram, it is worth noting
that they, too, have characteristics that are most comfortably explained via
the ES model. Pulsars are stars that have extremely short periods of
variability in their production of EM radiation (both light and radio frequency
emissions) . When they were first discovered it was thought that they
rotated rapidly - like lighthouses. But when the observed rate of
"rotation" got up to about once per second for certain pulsars, despite
their having masses exceeding that of the sun, this official explanation became
untenable. Instead, the concept of the "neutron star"
was invented. It was proposed that only such a dense material could make up a
star that could stand those rotation speeds.
Flying in the face of this observed fact, mainstream astrophysicists continue to postulate the existence of stars made up of solid material consisting only of neutrons, "neutronium". This is yet one more example of Fairie Dust entities fantasized by astrophysicists to explain otherwise inexplicable observations. The 'neutron star' is simply yet another fantasy conjured up, this time, in order to avoid confronting the idea that pulsar discharges are electrical phenomena. A nucleus or charge free atom made up of only neutrons has never been synthesized in any laboratory nor can it ever be. In fact, a web search on the word 'neutronium' will produce only references to a computer game – not to any real, scientific discussion or description. Lone neutrons decay into proton - electron pairs in less than 14 minutes; atomlike collections of two or more neutrons will fly apart almost instantaneously.
Perhaps some astronomers have begun to realize neutronium is embarrassingly impossible. In any event, a less easily falsifiable entity has now been proposed. Wal Thornhill has written about this latest mainstream explanation of pulsar emissions:
"The
discovery now of an x-ray pulsar SAX J1808.4-3658 (J1808 for short), located in
the constellation of Sagittarius, that flashes every 2.5 thousandths of a
second (that is 24,000 RPM!) goes way beyond the red-line even for a neutron
star. So another ad hoc requirement is added to the already long list - this
pulsar must be composed of something even more dense than packed neutrons - strange
matter! ...When not associated with protons in a nucleus, neutrons
decay into protons and electrons in a few minutes. Atomic nuclei with too
many neutrons are unstable. If it were possible to form a neutron star, why
should it be stable?"
"Strange
matter"! Yet another ad hoc fictional invention! They have been
getting away with this kind of nonsense for decades. How ludicrous does
it have to get before some responsible astronomer cries out that this Emperor
Has No Clothes On?
Hubble Space Telescope Observations Reveal Coolest and Oldest White Dwarf Stars in the Galaxy: "Using the Hubble Space Telescope, astronomers at the Naval Research Laboratory (NRL) have detected five optical companion stars orbiting millisecond pulsars. Only two other such systems are known. Three of the companions are among the coolest and oldest white dwarf stars known." [Italics added]
It is becoming obvious that pulsars are electrical discharges between members of binary pairs.
The Crab Pulsar
The
"Crab Nebula" (M1) is a cloud of gas (plasma) that is the remnant of
a nova explosion seen by Chinese astronomers. Lying at the
center of the nebula is a pulsar- a star called CM Tauri. The
frequency of repetition of the pulsar's output is 30 pulses per second. The
length of each flash, however, is approximately 1/1000 sec., one
millisecond! The obvious question to ask next is: Is this star a binary
pair? No companion is visible from even the largest earthbound
telescopes. But, the Hubble orbiting telescope has recently found a
companion, "a small knot of bright emission located only 1500 AU
(1500 times the distance from the Earth to the Sun) from the pulsar.
This
knot has gone undetected up until now because even at the best ground-based
resolution it is lost in the glare of the adjacent pulsar. The knot and the
pulsar line up with the direction of a jet of X-ray emission. A second
discovery is that in the direction opposite the knot, the Crab pulsar is capped
by a ring-like 'halo' of emission tipped at about 20 degrees to our line of
sight. In this geometry the polar jet flows right through the center of the
halo."

M1 - The Crab Nebula
Supernova Remnant G11.2-0.3
On
August 6, 2000, and October 15, 2000, the orbiting X-ray telescope Chandra discovered a pulsar
at the geometric center of the supernova remnant known as G11.2-0.3. This
observation provides strong evidence that the pulsar was formed in the
supernova of 386 AD, which was also witnessed by Chinese astronomers. The
official description of the image included the words:
"The
Chandra observations of G11.2-0.3 have also, for the first time, revealed the bizarre
appearance of the pulsar wind nebula at the center of the
supernova remnant. Its rough cigar-like shape is in contrast to the graceful
arcs observed around the Crab and Vela pulsars. However, together with those
pulsars, G11.2-0.3 demonstrates that such complicated structures are ubiquitous
around young pulsars."
Upon
examination, the image of the central star reveals that it is at the center of
a 'cigar shaped' plasma discharge, not a 'bizarre wind nebula'
(whatever that is). Although no binary companion has (yet) been found,
the presence of the observed plasma discharge makes one suspect it is only a
matter of time.
Electric Star Evolution
In
the Electric Star hypothesis, there is no reason to attribute youth to one
spectral type over another. We conclude that a star's location on the HR
diagram only depends on its size and the electric current density it is
presently experiencing. If, for whatever reason, the strength of that current
density should change, then the star will change its position on the HR diagram
- perhaps, like FG Sagittae, abruptly. Otherwise, no movement from one
place to another on that plot is to be expected. And its age remains
indeterminate regardless of its mass or spectral type. This is disquieting
in the sense that we are now confronted by the knowledge that our own Sun's
future is not as certain as is predicted by mainstream astronomy. We
cannot know whether the Birkeland current presently powering our Sun will
increase or decrease, nor how long it will be before it does so.
Summary
A
fresh look at the Hertzsprung-Russell diagram, unencumbered by the assumption
that all stars must be internally powered by the thermonuclear fusion reaction,
reveals an elegant correspondence between this plot and the Electric Star model
proposed by Ralph Juergens and extended by Earl Milton. In fact the
correspondence is better than it is with the standard thermonuclear
model. The details in the shape of the HR diagram are exactly what the
tufted electric star model predicts they should be. The observed actions
of nova-like variable stars, pulsars, the anomalies in the line spectra of
B-type stars, and the high frequency of occurrence of binary pairs of stars are
all in concordance with Thornhill's Electrical Universe theory, his stellar
fissioning concept, and the Electric Star model as well. Completely
mysterious and unexplained from the thermonuclear model point of view is the
'impossible' evolutionary behavior of FG Sagittae and V838 Monocerotis.
Yet these phenomena are perfectly understandable using the ES model. We
eagerly await NASA's next 'mysterious discovery' to further strengthen the case
for the Electric Star hypothesis.
From Electric Cosmos
@ http://electric-cosmos.org/indexOLD.htm
and http://electric-cosmos.org/hrdiagr.htm
For more information about our electric cosmos see http://nexusilluminati.blogspot.com/search/label/electric%20universe
- Scroll down
through ‘Older Posts’ at the end of each section
Hope you like this
not for profit site -
It takes hours of work every day by
a genuinely incapacitated invalid to maintain, write, edit, research,
illustrate and publish this website from a tiny cabin in a remote forest
Like what we do? Please give anything
you can -
Contribute any amount and receive at
least one New Illuminati eBook!
(You can use a card
securely if you don’t use Paypal)
Please click below -
Spare Bitcoin
change?
Xtra Images –https://blogger.googleusercontent.com/img/b/R29vZ2xl/AVvXsEgwsZjkfdBrCtTg6YzLN7Zg1z7A7dSx8wQkIQnRMCRf3fJGs-k_AP_aX5AfjGSgVndePTvgLHemgRSu-HLyhGBS0iUJVLsB0XFCeDiYu_fZB9y5Cscs0DfF8WqFrXUjN2-n0v9YMs2hsb0/s1600/Pulsar_Animation_hd720%25283%2529.gif
http://www.grandunification.com/jpgs/Crab_Pulsar_2.jpg
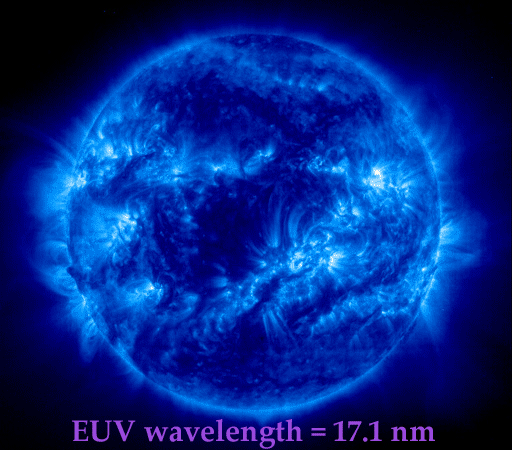
https://www.windows2universe.org/sun/images/ultraviolet_sun_anim_big.gif
For further enlightening
information enter a word or phrase into the random synchronistic search box @
the top left of http://nexusilluminati.blogspot.com
And see
New Illuminati – http://nexusilluminati.blogspot.com
New Illuminati on Facebook - https://www.facebook.com/the.new.illuminati
New Illuminati Youtube Channel - http://www.youtube.com/user/newilluminati
New Illuminati on Google+ @ https://plus.google.com/115562482213600937809/posts
New Illuminati on Twitter @ www.twitter.com/new_illuminati
New Illuminations –Art(icles) by
R. Ayana @ http://newilluminations.blogspot.com
The Her(m)etic Hermit - http://hermetic.blog.com
DISGRUNTLED SITE ADMINS PLEASE NOTE –
We provide a live link to your original material on your site (and
links via social networking services) - which raises your ranking on search
engines and helps spread your info further!
This site is published under Creative Commons (Attribution) CopyRIGHT
(unless an individual article or other item is declared otherwise by the copyright
holder). Reproduction for non-profit use is permitted
& encouraged - if you give attribution to the work & author and include
all links in the original (along with this or a similar notice).
Feel free to make non-commercial hard (printed) or software copies or
mirror sites - you never know how long something will stay glued to the web –
but remember attribution!
If you like what you see, please send a donation (no amount is too
small or too large) or leave a comment – and thanks for reading this far…
Live long and prosper! Together we can create the best of all possible
worlds…
From the New Illuminati – http://nexusilluminati.blogspot.com
Your children are taught nonsense by time serving dullards with no ideas. READ the TRUTH - and PASS it ON!
ReplyDeleteAmazing post...Thanks for sharing.
ReplyDeleteSky Ceiling Light Box